
Squircles
Why do Apple's rounded corners look so good? Because they are squircles!
Ok… what are squircles? They are a special case of super-ellipses, a generalization of ellipses. Mathematically, super-ellipses take the form (relation)
1 = |(x - a) / r_a|^n + |(y - b) / r_b|^nwhere (a, b) is the center of the ellipse and r_a and r_b are the semi-major and semi-minor axes.
For a squircle centered at (0, 0), this simplifies to:
1 = |x|^4 + |y|^4Now what is this n? It is the degree of the super-ellipse. If you plug in 4, then you’ll get the squircle; if you plug in 2, then you’ll get the regular circle.
How To Use
The question still remains: how do you use squircles. Because, ideally, every web dev should be using them, or at least trying them out. The sad part is that CSS does not support it. We’re still stuck on regular circles with border-radius.
However, there are some tricks. You could render a squircle to a png and then mask out the background with CSS. But this approach is not handy (think serving the png, responsive web design, etc.).
SVGs!
Yes. They are the right tool for the job. Specifically, Bézier curves. Go check them out if you’re not familiar.
I mean you could approximate a squircle by sampling points and connecting them via lines. This is what this generator does. But this is just bloat and does not look good on higher sizes and resolutions.
So we’re using cubic Béziers. I have prepared this setup for you:
You can play around and try to approximate the circle or the squircle. The approximation works surprisingly well!
Calculating ks
(If you just need the constants, feel free to skip to the section.)
How do you even calculate this k? Let’s say I want to find the best k for an n-squircle, how do I do that? Beware, there is some advanced math ahead…
First, I simplified the problem to the first quadrant of the squircle:
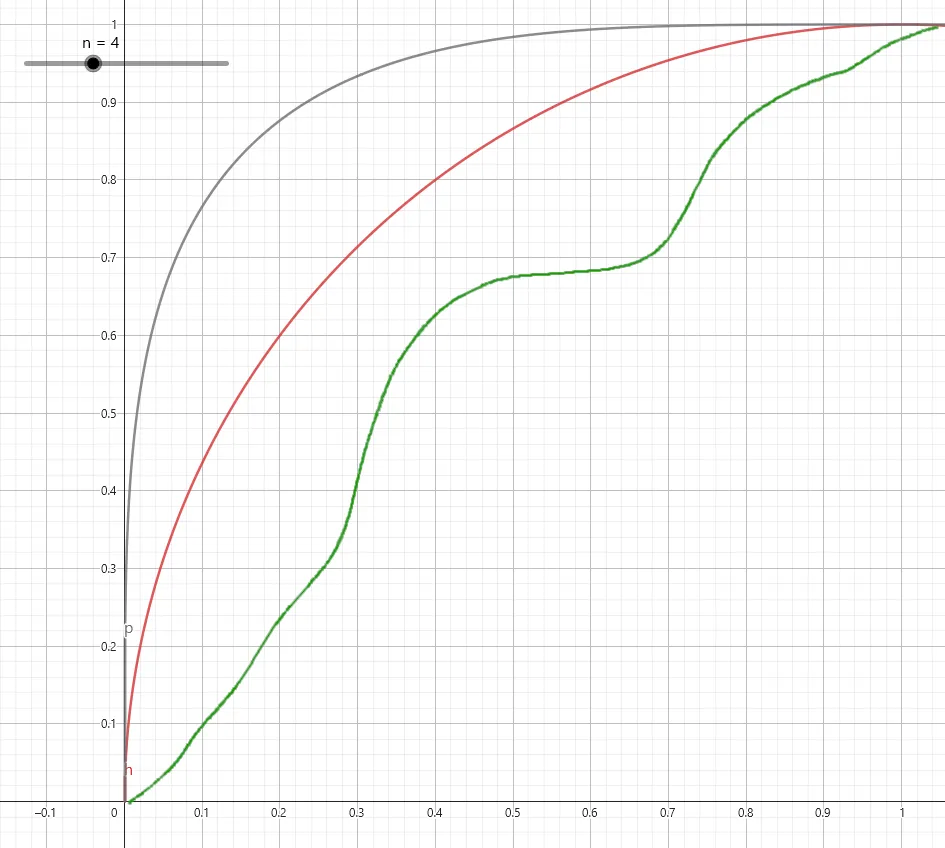
Here we have a (crude) drawing of the green function that should resemble the Bézier approximation. This function is dependent on k. Additionally, we have a squircle curve dependent on n, here drawn for n=2 (red) and n=4 (black).
Instead of directly calculating k, we just try a value and calculate a “score”. Then we find the k with the best score. It is that simple… until it is not.
Well, first we have to calculate this “score”. We’ll do that by sampling both functions on a wide range of x values. The score is the average distance between the sampled points of the Bézier and the squircle. Like this:
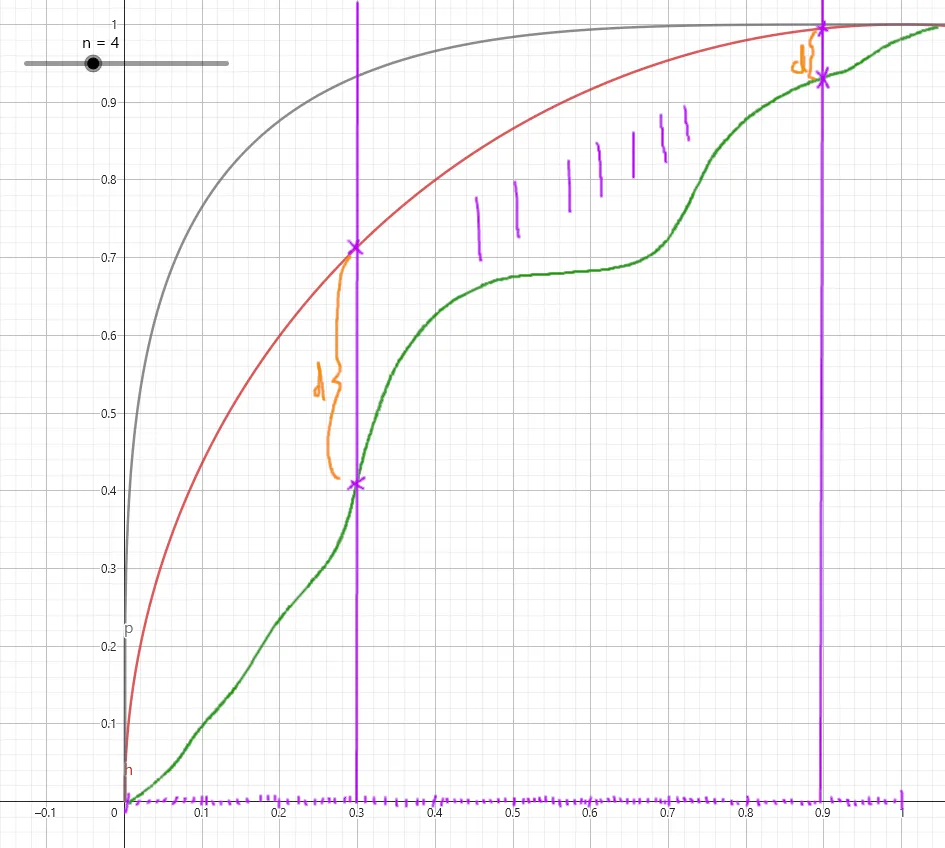
(two samples depicted.)
The questions are: why are we sampling x-values and not t-values? After all, Bézier curves are parameterized. The answer is simple: both functions grow differently for the same values of t. Ideally, we would want both functions to intersect a polar line for the same t values, but this is not true. Here is an illustration:
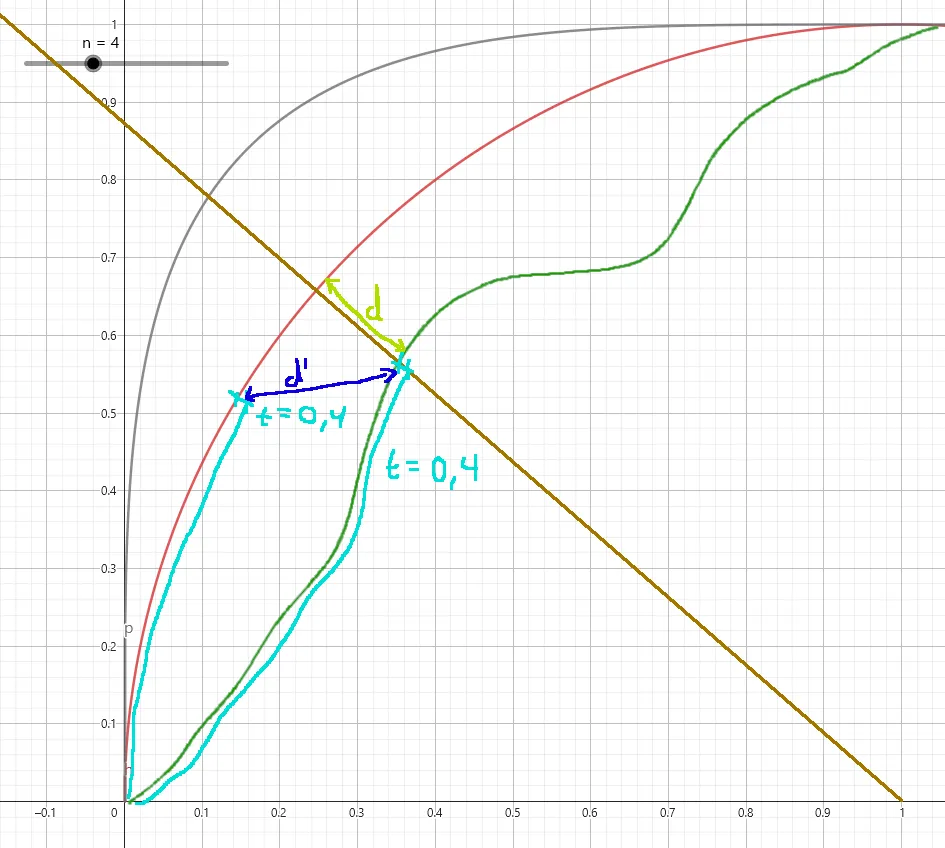
(These are not real values for t, nor the distances. It is an illustration.)
Ideally, we would like the lime distance d, but we’d get the blue distance d’ with this approach. This is why we use x-sampling.
The Bézier Polynomial
How can we even describe (cubic) Béziers mathematically? Freya Holmér has a great video about Béziers; you should really go watch it. Anyway, the important part is the formula:
P(t) = (1 - t)^3 * P0
    + 3 * t * (1 - t)^2 * P1
    + 3 + t^2 * (1 - t) * P2
    + t^3 * P3
It describes the current point P depending on t with the start point P0, the first control point P1, the second control point P2, and the end point P3. What matters the most is that this is a degree three polynomial.
If we want to sample x, we need some way to get y. This is the basis for a function. But we don’t have that right now. We only have a way to produce 2D points for a t. But if we have the t, then we can calculate the y.
So for the function x(t) (which is just the x-component function), we need the inverse, t(x). But first, let’s define some points.
To fit the Bézier into the first quadrant, with P(0) = P0 = (0, 0) and P(1) = P1 = (1, 1), we set:
P0 = (0, 0)
P1 = (0, k)
P2 = (1 - k, 1)
P3 = (1, 1)
By substituting, this gives us this component function (we don’t need y(t)):
x = x_k(t) = (3 * k - 2) * t^3
    + 3 * (1 - k) * t^2
To get t_k(x), we have to invert that function. This is not simple. Basically, what we have to do is solve this for t:
0 = (3 * k - 2) * t^3
    + 3 * (1 - k) * t^2
    - x
There is an algorithm that does that, which I’ve implemented. It is called Cardano’s formula / method. Basically, it allows iterating over all solutions to the following equation:
0 = a * x^3 + b * x^2 + c * x + dI spare you the details, now we will just assume a function
invAt(a, b, c, d, min, max)…with the coefficients of the polynomial and bounds for the interval, in which the root is assumed to be. Now, we can formulate t(x):
t_k(x) = invAt(
    (3 * k - 2),
    3 * (1 - k),
    0,
    -x,
    0,
    1
)
Putting It All Together
Then we can take any x, calculate y_Squircle directly and t_Bezier, as well as y. Let’s define the score (or error) function:
                           999,999
score(k) = 1 / 1,000,000 *    Σ    |y_Squircle(x / 999,999) - y(t_k(x / 999,999))|
                             x=0
Now, we need to find the k with the minimum score (the global minimum). In other words:
δscore(k)
--------  = 0
δk
…we’ll let a numerical approximation handle this.
And now we’re done. We calculated the best k for an n.
Squircle Approximation Constants For Cubic Bezier Curves
k(1) = 4.674436077849779e-13 ≈ 0,
k(2) = 0.5520088295484566,
k(3) = 0.7901141675708816,
k(4) = 0.9181776924287774,
k(5) = 0.996368389797325,
k(6) = 1.0469230714660918,
k(7) = 1.0823616187547969,
k(8) = 1.1098207403858118
These constants have been calculated by Rust using custom code with one million x-samples for each invocation of the score function. The minimum k is found using a numerical approximation down to 10^-12 precision.
I plan on open-sourcing the code. There will also be a tool that generates SVG squircles; but for now you can use the interactive demo from above and copy the SVG path from the dev tools.